
For centuries, the Danube was an untamed natural space. The river and its banks obeyed the dynamics of water and the changing seasons, occasionally flooding several times a year. This did not change until the 19th century when the Habsburg Monarchy set itself the task of taming the river and thus opening up a huge economic and cultural area.
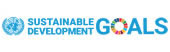
In 1857, the Imperial-Royal State Ministry began this by publishing a map, showing an extremely precise image of the Danube in the territory of the Habsburg Monarchy from Passau to the Iron Gate.
The map was named after the hydro-technician and court official Florian Pasetti, who was responsible for the publication.
Its purpose was to create public awareness of the political and economic importance of this waterway for the entire Austro-Hungarian Empire.
In 1870, the regulation work of the Danube began in Vienna. The river soon became a major waterway connecting the various countries of the multi-ethnic empire.
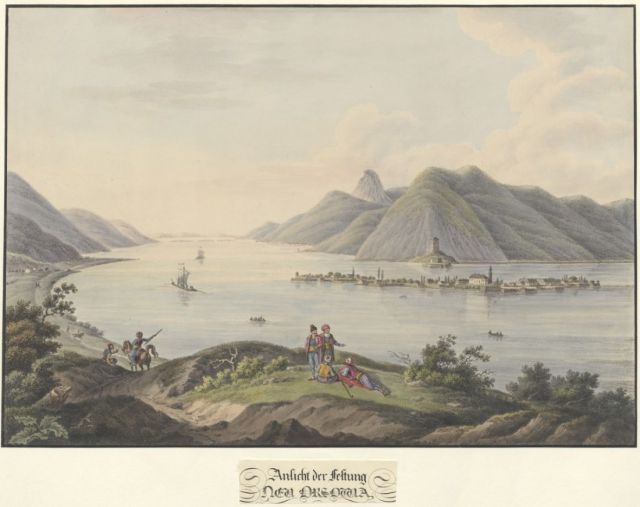
Cartographers and scholars have been attracted by the Danube region for centuries. In his book on the Kingdom of Hungary, Totius Regni Hungariae superioris et inferioris accurata descriptio, published in 1686, Georg Krekwitz describes cities along the Danube from Donaueschingen to Constantinople. His map of the island of Žitný ostrov (Great Rye Island) with the fortified cities of Bratislava, Leopoldov, Györ and Komárno depicts the biggest river island in Europe.
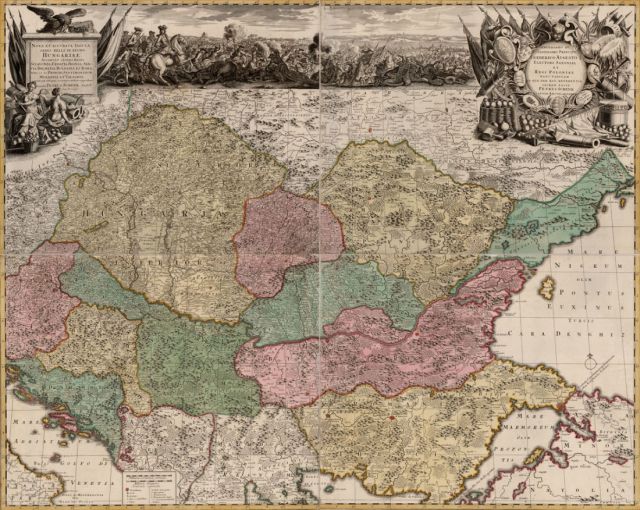
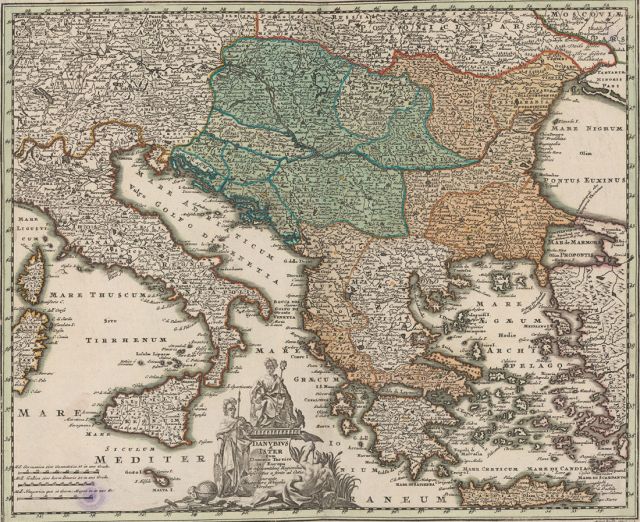
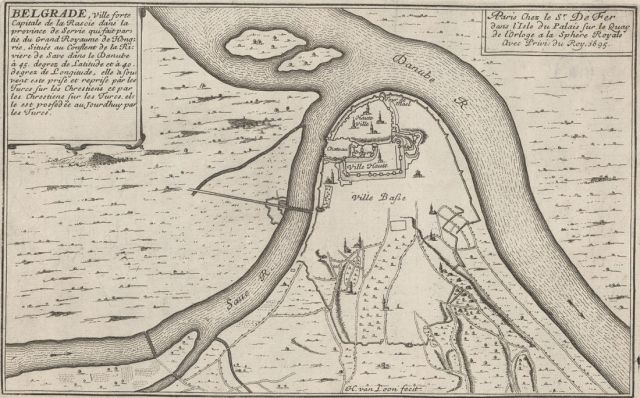
The lower parts of the Danube, Hungary and the Balkans are depicted in the map Nova et accurata tabula sedis belli in regno Hungariae.
This map is one of several beautiful cartographic representations of the Danube region made during the Christian-Ottoman battles of the 17th and 18th centuries.
It was published in 1717 by the German engraver and map publisher Petrus Schenk (1660 – 1711), who was born in Elberfeld (Wuppertal) and moved to Amsterdam in 1675. He became a famous engraver and map-seller with stores in Amsterdam and Leipzig.
Historic cartographic representations of territories include principal waterways, depictions of cities and ethnographic or historical information.
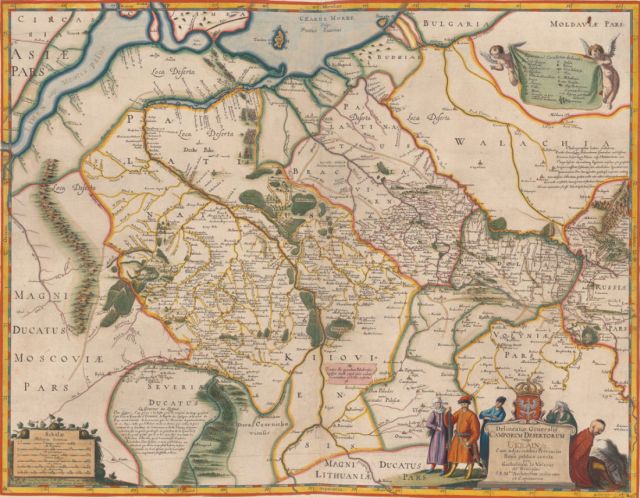
A series of maps of Ukraine created from the mid to the late 17th century by Guillaume Le Vasseur de Beauplan (c. 1600 – 1673), a French-Polish cartographer, engineer and architect, is no exception.
In 1639, Beauplan created the first 'descriptive' map of Ukraine. Thanks to Beauplan, the term Ukraine or The Land of Kazaks had been firmly fixed in European cartography. In the 17th and 18th centuries, the maps of Beauplan were widely used by European cartographers to depict the Ukrainian territories, including cities like Reni, Ismail and Kilia located at the river Danube.
His map of 1648, shown here, includes detailed border information, including Tatar routes and fortifications.
A panel of experts give their solutions
From education to legal reform, at the close of the Guardian’s Pacific Plunder series, leading Pacific thinkers offer solutions
Over the last month, the Guardian has run a major investigative series examining the extractives industries – mining, logging, fishing and the nascent industry of deep-sea mining – in the Pacific. Among the stories of environmental devastation and social harm are also stories of Pacific communities taking control of their resources and succeeding in resisting unwanted extractive projects.
As the series comes to a close, four Pacific leaders and thinkers, from across the region, offer solutions to the problem of Pacific plunder.
‘Pacific solutions need to be led by Pacific peoples’
Dr Katerina Teaiwa is an associate professor in Pacific Studies at the Australian National University
Former and current imperial powers, including the United States, Australia, the United Kingdom, New Zealand, France, Canada, Japan, China and Indonesia have had and continue to have significant impacts on the cultures and environments of Oceania.
It is critical that these nations attend to the ongoing need for environmental and historical justice including for mining, nuclear testing, deforestation, the Pacific slave trade, land alienation, World War II, climate change, and the displacement of Pacific populations within and across state borders. Such support spans the range from funding for education, health, and social and cultural wellbeing, to the removal of unexploded ordnances and environmental repair.
The island of Banaba, for example, mined out for phosphate by Australia, New Zealand and the UK, is a denuded and heavily polluted landscape filled with mining and industrial debris that regularly faces serious fresh water shortages. The entire landscape needs rehabilitation. At six square kilometres, such repair is achievable with Banaban knowledge, innovative thinking, and commitments from the responsible governments, and Kiribati where Banaba is located.
Current aid and development agendas and programmes often exacerbate rather than balance out the impacts of these changes. The Pacific Seasonal Workers Programme, for example, if uninformed by histories of the slave trade and the current experiences of Australian South Sea Islanders, risks reproducing unequal social, political and economic relations between Australia and the Pacific Islands where the benefits accrue primarily to Australian agriculture and stakeholders.
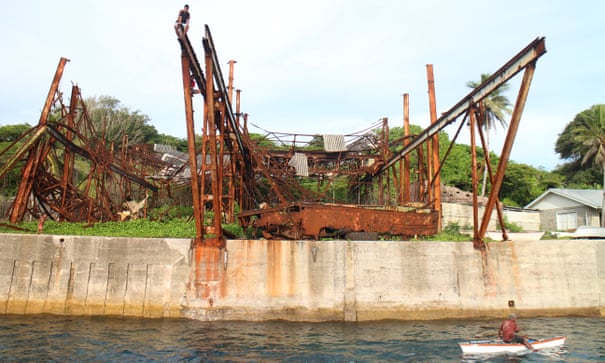
The old cantilever that used to load phosphate onto the ships. Banaba, central Pacific island, Kiribati. Photograph: Janice Cantieri
In order to appreciate the lessons of history, we need better support for Pacific Studies education across the region and within countries such as Australia, that foregrounds Pacific agency, creativity, histories, knowledges and diverse identities.
Leadership from Pacific women, Pacific youth, and those of diverse genders, also needs to be recognised and prioritised in regionalism, policymaking and caring for land and sea. Sovereignty and self-determination are key and Pacific solutions need to be led by Pacific peoples themselves. You’d think we’d be closer to achieving such sovereignty in our own affairs. Unfortunately, colonial and imperial thinking, and geopolitical wrangling, persists. Some of our own leaders, aid donors, policymakers, foreign affairs journalists and academics continue to treat the Pacific as “underdeveloped” and incapable of determining our own lives and futures. That attitude needs to change.
‘Pacific Island countries need wholesale legal changes’
Dr Bal Kama is a solicitor with the international division of the Environmental Defenders Office Australia, an expert in Pacific Islands constitutions and a Fellow at the Department of Pacific Affairs at the Australian National University
To combat the exploitation of natural resources and its often disastrous consequences for the environment and local communities, Pacific Island countries need wholesale legal changes, greater investment in enforcement and a recognition of Indigenous knowledge of managing resources.
Many Pacific countries continue to rely on colonially influenced resource laws intended to favour foreign companies, such as the terms of the mining laws of Papua New Guinea (PNG) which has raised significant concerns in recent years and continues to be echoed under the current government. There is the need for laws that reflect the expectations of the people as well as international best practices.
Once equitable laws are in place, there is a need for effective enforcement of laws and meaningful prosecution. Remote geography, vast sea territories, and lack of appropriate technology and logistics present challenges to enforcement agencies. It requires good investment in policing and justice institutions, deepening of regional collaborations and for offenders to be competently prosecuted under laws that are updated and substantively punitive. In PNG, the continued use of the Special Agriculture Businesses Leases (SABLs) where customary lands were leased to resource companies despite clear government ban on the use of SABLs demonstrates a breakdown in effective enforcement.
Pacific Island countries have one of the highest rates of indigenous peoples of anywhere in the world. There is a need for greater recognition of traditional owners and their ways of sustainably managing their natural resources. Indigenous knowledge and concerns about natural resource management are often neglected. The rigidity of the legal system also means people do not have ready access to avenues of seeking meaningful justice for the plunder of their resources.
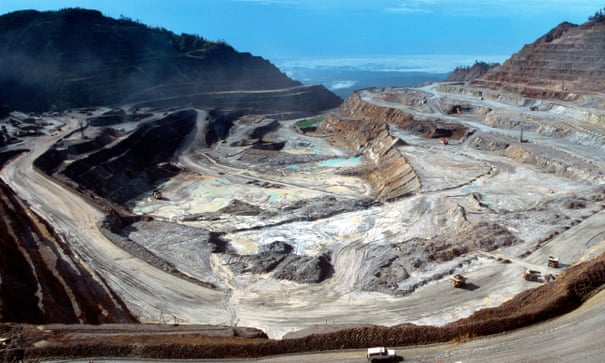
The Ok Tedi Copper mine near Tabubil in Papua New Guinea. Photograph: Friedrich Stark/Alamy
An effective way of dealing with these issues is to strengthen civil society. A robust civil society is important in the absence of strong positive political leadership in protecting the environment and holding government and industry to account. Presently, civil society environmental, indigenous, and public interest environmental law organisations are in their nascent stage in the Pacific and are lacking in resources. Their role needs to be factored into the larger environmental discourses in the Pacific and supported at national and regional levels.
‘Education will help us see other options’
Dorothy Wickham is a journalist from Solomon Islands
Solomon Islands has been struggling with the issue of logging for decades and we are losing all our native forests.
As a local journalist, I have covered the logging industry and I have seen the economic and social fallout, and the damage to the environment of my country.
Whilst there has been so much awareness-raising work done on the effects on logging, Solomon Islanders still choose to log. There are so many reasons for landowners choices but the most obvious one is financial.
Solutions are difficult and will have to come from the government. We need to ban logging and drive landowners towards planting forests or go into down streaming and produce timber.
However, the government will not be making this decision soon as logging has been a major contributor to our national and rural economies for several decades. Logs alone contribute between 50%-70% to Solomon Islands annual export revenue.
The economic reality for an ordinary Solomon Islander is tough, so talking conservation to him or her is an uphill battle.
However, education is also a solution to ensuring landowners understand the long term effects of logging and to choose to think of tomorrow instead of today.
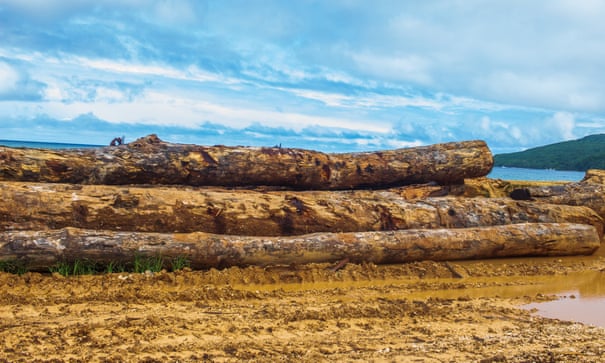
Logs await transportation on Rennell Island, Solomon Islands. Photograph: Zahiyd Namo/Aelan life photography
Education will bring awareness of other options to young Solomon Islanders, other than working in logging. Currently, education is not free in Solomon Islands and we have more than 3,000 kids drop out of school before finishing each year, which doesn’t count the large number of children not in school at all because their parents can’t afford it.
If I was the Prime Minister, I would ensure that all Solomon Islanders were given free education and support academic and skill based training for all citizens, then maybe we could look past using our natural resources as the only way to generate income.
‘Leaders and bureaucrats have forgotten how to do meaningful community participation’
Vani Catanasiga is the executive director at Fiji Council of Social Service, an NGO platform that was established in 1957 in Fiji
Meaningful community participation and obtaining communities’ free, prior and informed consent can be testing, particularly in indigenous communities, but I believe it is the key to finding better solutions for the challenges we face in terms of climate change, natural disasters and sustainable resource management.
The challenge is re-teaching this “new” science, because, in my experience in both Fiji and the wider region, both leaders and bureaucrats have forgotten how to do this effectively.
Any suggestion of community consultations is seen and approached with wariness, reluctance and sometimes hostility - even though some of our resource management laws have already got these community participation clauses.
The iTaukei Land Trust Act for example already compels developers to demonstrate consent from 60% of clan/landowning unit members before any work is done.
The limitation however is in how this consent is obtained as clan members can be approached individually to sign on, which goes against the communal and collective nature of decision-making within indigenous/iTaukei communities. A better way of obtaining the required 60% per cent would be to make sure it is gained during special clan meetings.
Another area for improvement is the Environment Management Act which requires that Environment Impact Assessments (EIA) for development projects be carried out and must include community consultations. .
But the Fijian government must improve this process by extending the number of days given to the public and communities to make a submission as well as ensuring that the notice calling for public consultations goes out widely via various media platforms.
There have been widespread criticisms of the EIA’s public consultation process because companies have often only provided information about proposed developments in English and not in the vernacular.
The role of government agencies, particularly that of provincial development or provincial councils officials, have also been criticised for the way they facilitate connections between developers and communities. We have had cases where government officials were seen driven to the consultations on vehicles belonging to the mining companies who were proposing the work. The impression that creates with villagers is that the government was for the company and the proposed mining development, leading to villagers being confused and not feeling free to consent to or reject the proposed mining project.

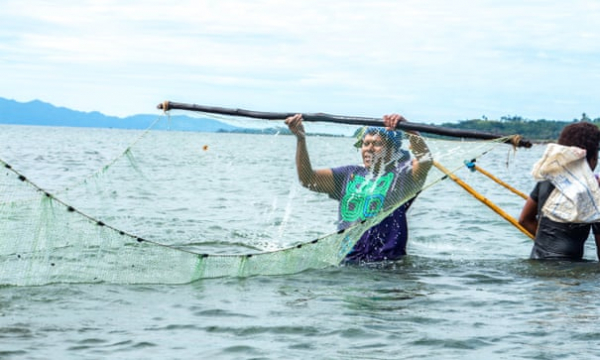
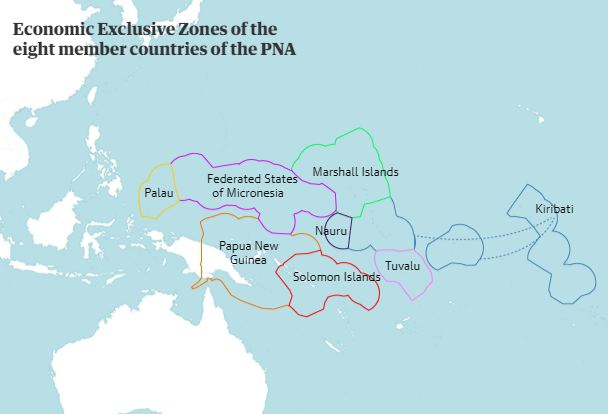
Eight Pacific countries created a revolutionary system that brings in $500m a year and prevents the overfishing that blights other regions
It has been described as “the most remarkable achievement of the Pacific island countries in the last 50 years”.
In 1982, eight, mostly minuscule Pacific island countries in whose waters much of the world’s skipjack tuna was caught got together and decided to do something to get a share of the profits, of which they received precisely nothing.
In a shining example of regional cooperation, the group, known as the Parties to the Nauru Agreement (PNA), successively outmanoeuvred the United States, Japan and Taiwan, and later mainland China and the European Union.
“It was a David versus Goliath situation from the start,” said Jonathan Pryke, director of the Pacific Islands Program of the Lowy Institute in Sydney.
Over four decades of trial and error, they created a system that Pryke calls “revolutionary” that today not only yields them half a billion dollars a year but also prevents the overfishing that international fishing fleets have carried out to deplete the waters of most poor countries.
They were, from east to west, six micro-states made up mostly of tiny islands (Kiribati, Marshall Islands, Tuvalu, Nauru, the Federated States of Micronesia and Palau) and two midsized countries, Papua New Guinea and Solomon Islands.
The mice that roared: Photograph: Opla/Getty Images/iStockphoto
The key to success, said Ludwig Kumoru, the outgoing chief executive of the PNA, was to jettison a system in which the PNA nations undercut each other in trying to sell fishing rights in their waters to foreign fleets – and replace it with another, called the Vessel-Day Scheme. That scheme sees them calculate how much tuna fishing is sustainable and then divides that amount up into fishing days for which fishing companies bid.
“We set the minimum price of a day at US$8,000 a day, up from $2,500 at the beginning, but demand was so high that we’ve been getting $12,000 to $14,000 a day,” Kumoru said.
“All our fish stocks are healthy,” said Transform Aqorau, a Solomon Islands lawyer who became the first chief executive of the PNA in 2010, and was largely responsible for introducing the scheme.
“And they are likely are likely to remain healthy if recent levels of exploitation continue,” confirmed John Hampton, chief scientist as the Secretariat of the Pacific Community, the region’s top fisheries scientist.
‘Host countries weren’t getting a penny’
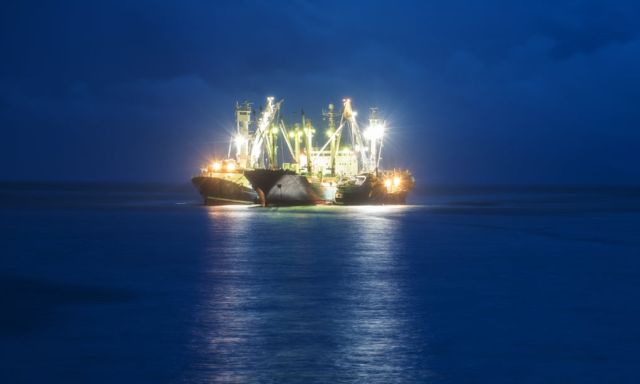
Sean Dorney, a veteran Pacific correspondent for the Australian Broadcasting Corporation, remembers being present at the creation of the PNA in 1982 – a meeting on the phosphate-rich island nation of Nauru of the fisheries ministers of the 16-nation Forum Fisheries Agency, which oversees fishing in the Pacific and includes Australia and New Zealand. Dorney flew in from Port Moresby because he sensed something big was about to happen.
“There was a palpable sense of frustration,” he said. “None of the fish was being landed in any of the eight countries where they were fished, they were all trans-shipped to refrigerated ships and taken to Bangkok or Japan, and the host countries weren’t getting a penny.”
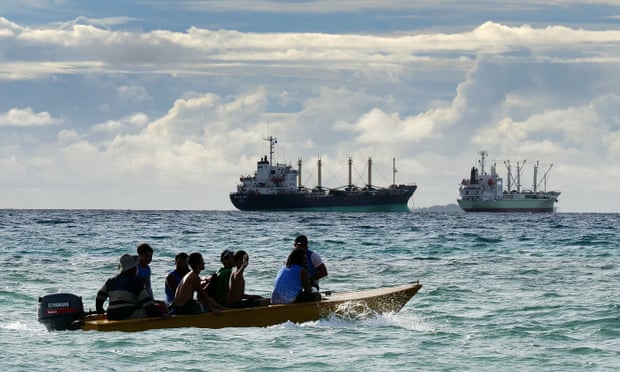
Local fishermen in Tuvalu see a familiar sight nearby. Photograph: Fiona Goodall/Getty Images for Lumix
When the eight countries signed what would become the original Nauru agreement – to coordinate their relations with the foreign fishing fleets – “They had no clear sense of what they realistically could expect,” Dorney said. “All we knew was that this was a historic moment.”
Looking back, “the creation of PNA is probably the most remarkable achievement of the Pacific island countries in the last 50 years, a shining example of cooperation,” he added.
Lowy’s Pryke said: “In today’s climate, it would be much harder to create a PNA, because regionalism is at a low ebb.”
The PNA took years to refine into a system that generated significant profit for the Pacific nations. Fees grew slowly in the decade after signing the PNA.
By the mid-1990s, the massive expansion of the international tuna fleets was beginning to peak, but the eight countries were receiving a tiny fraction of the profits realised by the fleets when the fish was landed. “So there was no real cap, no competition and no scarcity, and the fees they collected were still way below 5% of the landed value of the fish,” said Michael Lodge, a young British lawyer, joined the Forum Fisheries Agency, the regional agency that supervised Pacific fishing, as its legal adviser in 1989.
It wasn’t until 2011 that the PNA hit on the winning formula. The Vessel Day Scheme, which had already been implemented, was refined to allow the secretariat to sell days valid in all eight countries, then bill the fleet for the days fished in each country and pass on those fees to the countries.
The system also allowed the countries momentarily without fish – say the Western Pacific’s Federated States of Micronesia in an El Niño year – to sell its days to the Central Pacific’s Kiribati, where the fish were, and Kiribati could resell them to the fishers, evening out the yearly revenues of each state.
This trading enormously increased the value of each day, said Aqorau. “Now we’re getting 25% of the dockside sale price of the skipjack, up from 2% or 3% a decade ago.”
For Kiribati, which has the group’s biggest Exclusive Economic Zone (bigger than the land area of India) but one of the smallest economies (it has just 113,000 people), the scheme has raised fishing revenues from $25m a decade ago to $160m, or $1,400 per capita, allowing for all manner of social spending and infrastructure work, notably to raise the frequently flooded, overpopulated parts of Tarawa, the capital, as well as to provide government funding for students, people with disabilities, those who are unemployed, and elderly people.
“It’s hugely improved the life of the people,” said former president Teburoro Tito.
In Papua New Guinea, the largest country and economy in the Pacific Islands, the increase in fees income from $20m to $80m a year has been mostly earmarked to develop sustainable coastal fisheries and cooperative fish farming.
“It’s made a big difference in coastal communities,” added Kumoru, the PNA’s acting chief executive, who is from PNG.
By Christopher Pala
Over the centuries, the banks of the Danube formed a large settlement area. Towns and markets, monasteries and churches, castles and palaces along the Danube all bear witness to bourgeois industriousness, noble representation and ecclesiastical triumphs.
But the fortresses and many memorials also tell of war and hardship, of brutal persecution of Protestants, of the expulsion and murder of Jews, Roma and Sinti, of poverty and persecution, of war and political struggles.
Conflicts between the Habsburgs and the Ottomans lasted almost two centuries. Many of their battle sites and fortresses are located along the Danube: Vienna (besieged in 1529 and 1683), Komorn/ Komárom/Komárno, Raab/Györ, Gran/Estergom, Visegrád, Waitzen/Vác, Budapest, Neusatz/Novi Sad, Peterwardein/Petrovaradin, Slankamen, Semlin, Belgrade, Semendria and Orsova.
A journey into the past along the Danube also reminds us that a peaceful present and Europe as a continent of peace is not self-evident, but an achievement that demanded many sacrifices and that could only be secured after many destructive wars through diplomatic negotiations and through international treaties.
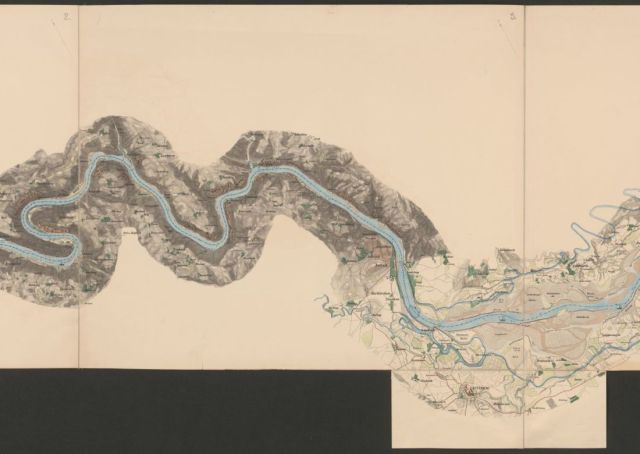
The imposing Peterwardein Fortress (today in Serbia) was built from 1692 as a Habsburg bulwark against the Ottomans on the middle Danube. It reminds us of the conflicts between two great European empires for supremacy in the Danube region, which broke out again and again. Yet also on its lower course, the Danube became a contested area of conflict for centuries.
The question of spheres of influence in the Danube basin, especially in the Lower Danube and the straits (Bosporus and Dardanelles), was of central importance both for the neighbouring states (and above all for Austria) and for the Ottoman and Russian Empires, as well as for England and France.
Free navigation was established on the Danube in 1815, with the Congress of Vienna decreeing that international rivers must be open to all states for merchant shipping.
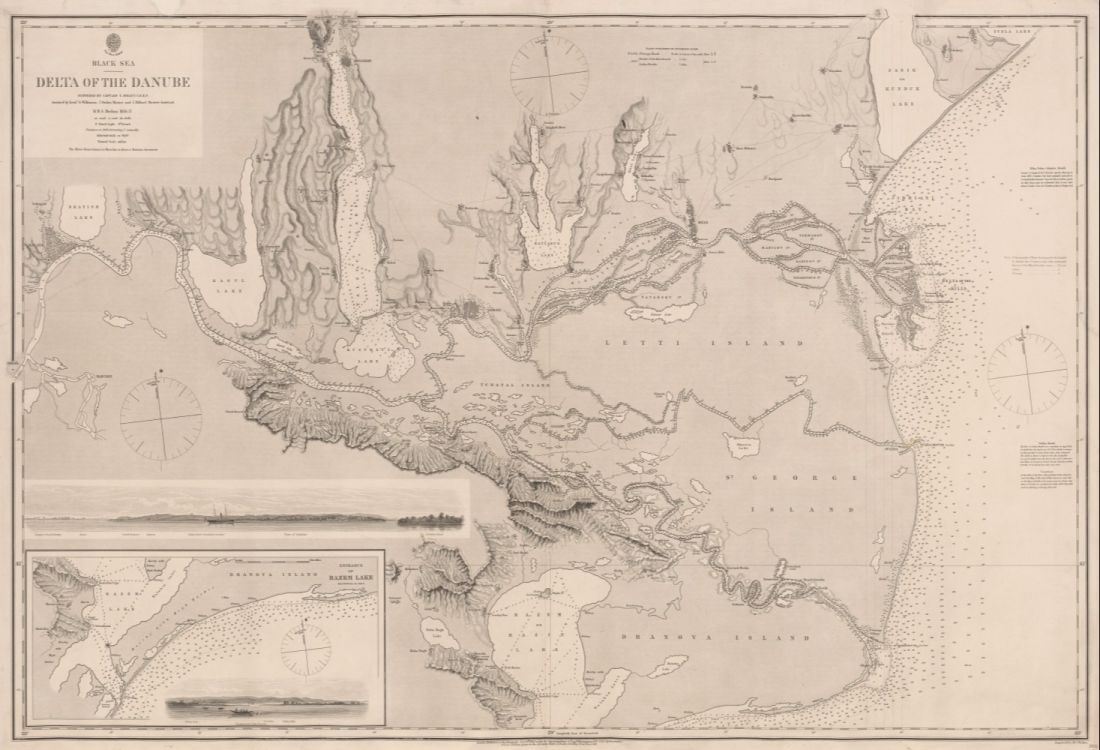
But it was not until the European powers gave guarantees in the Peace Treaty of Paris, which ended the Crimean War in 1856, that the Danube was truly open to international shipping. In the same year, the European Danube Commission was established. Based in Sulina in the Danube delta (in what is now Romania), it was the supranational authority for the regulation of shipping on the river.
The Danube Commission was re-established in Belgrade in 1948 after World War II and, since 1954, it has been based in Budapest.
Today, it is the international inter-governmental organisation ensuring free navigation on the Danube.
All the countries along the Danube are members, with the primary objective of achieving a unified waterway system in Europe. One of its greatest challenges at the end of the 20th century was to make the Danube navigable again after the Yugoslav wars.
Gornje Podunavlje and High Waters Problem
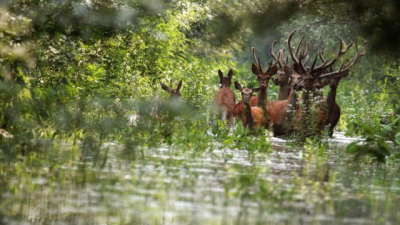
The area of Gornje Podunavlje is extremely flood-prone, as well as the entire territory of the upper Danube on the left bank of the river, and it continues on the right bank, known as Kopački Rit.
The geological material is represented by quarterly creations, which make the reticulated layer of Pliocene sediments. Soil is alluvial river values, mostly recent fresh alluvium, which is performed by new precipitation of materials every year when the flooding is performed. A wetland appears with a layer of clay in the background, and in higher parts, the Swamp rich soil "Crnica" and Chernozem with salt soil flows.
As the Danube performs alluvial infusions, as well, in the high water levels of the river, there is a significant erosion, in the first place of River Islands (ADA) and then unprotected parts of the river bank. The erosion of the coast in the newer period (the past twenty years) is known where the erosion was influenced by the river navigation course, where the Danube entered up to 430 meters into the mainland for about 5 kilometres long.
Construction on alluvial clay and sandy flood land are possible and feasible as seen in bungalows and holiday houses on either side of the riverbed. Namely, the style of construction that is applied here is modelled on the classic "sojenica" technique. The facilities are designed and masoned on pillars that provide a safe elevation in the case of the rise of the river up to medium water levels.
The territorial area of flooding land is 83.6 m above sea level to 86.6 m above sea level, while the standard waterway is 80.64 m above sea level. It looks very encouraging since the standard (middle) water level is lower than the lowest land point for almost 3 meters. However, extremely high oscillations of the Danube levels, often cause the area to flood, partially or the entire region. If we look at historical minimums and maximums, we will see that in 1909, the minimum was 79.22 mnm (water level -142) while the historical maximum was in 1965 at 88.40 MNM (water level +776), we will see that this is about up to 10 meters of deviations.
Although the historical maximum was back in 1965, medium-high and high water levels were measured relatively recently. For example, in 2002, a very high water level was measured from +742 (88.06 MNM) which is only about thirty centimetres lower than the historical maximum. Protective barriers that were built after 1965 can endure up to 90 m and it is considered quite enough to prevent catastrophic spilling of the Danube as in 1965. Also, the right side of the river is very well provided, both natural terrain configuration, and assisted by artificial barriers.
Of course, some areas are not included in the flood defence system.
How to protect the territory and on it successfully and purposefully raise buildings facilities?
In general, there are three basic methods and their combinations:
1. Construction of the banks, raising the embankment that would cover the territory of seven square kilometres, using as a model major earthworks in the Netherlands.
Problem: Raising the embankment that should be in a total length of about 11 kilometres and 4 meters (5.5 to 3 meters, depending on the terrain configuration. It would mean a barrier to install about 500,000 cubic meters to be installed Materials (soil, stone ...). This amount of material cannot be obtained on the territory of Gornje Podunavlje or its surroundings. The supply of such material is from locations that are 300 - 500 km away.
Of course, such "closure" of the territory is no guarantee that the built-in "pool" will not emerge from the underground sources to form an artificial lake.
2. The construction of facilities on the pylons would ensure the safety from floods, however, this causes access and infrastructure problems. The possible solution could be raising a road infrastructure above high water levels, meaning orientation on which 90 Mnm, bringing sand road solved. In this way, it would be provided to switch to the third construction modality.
3. The combined solution would probably be most suitable and most economical: preparation of a solid barrier in the highest region that is 85.5 mnm to 86.0 mnm. In this way, about 1/10 of the territory could be protected. The road cross-network is fixed the balance of barrier (bent) and inside the field build facilities on the pylons and dike the basins with alluvial sandy material that will deposit over the barrier over time.
In the future, build an extended travel network and thus gradually conquer new surfaces outside the scoring of flooding at high water levels. Of course, the new road network will be urban planning so that a segment by segment can be extracted in the future and expand useful territory.
Zoran Dražić
Member of Scientific Committee at International Water Conference
Land surveyor & GIS projectant
Floating power plant
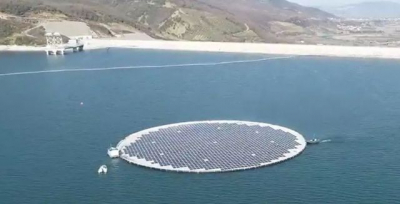
Renewable energy company Statkraft has started commercial operations at the first unit of its floating solar power plant in Albania in cooperation with Norwegian supplier Ocean Sun. The two companies have implemented an innovative solution for floating solar projects.
Floating solar project is located at the Banja reservoir in Albania, where Statkraft is operating its 72 MW Banja hydropower plant. The first unit has an installed capacity of 500 kW.
The project is expected to continue its second implementation phase during the second half of 2021, whereby additional three floating units will be installed, with a combined additional capacity of 1.5 MW, Statkraft said.
After the successful completion of the first floating solar unit and connection to the grid, the plant is now generating renewable energy and injecting the power into the Albanian national electricity grid.
The first unit comprises 1,536 solar panels and covers almost 4,000 square meters. In addition, 160 panels have been placed on land for comparison and documentation of the cooling effect on the floating panels.
According to Statkraft, floating solar power involves installing solar panels on floating structures on a body of water, such as a lake, fjord or ocean, or in a hydropower reservoir. Each unit consists of a floating ring and a thin membrane. Combined with the cooling of the panels from the water below, the membrane and the large area make the concept unique.
The technology is developed by Ocean Sun and although the membrane is only a few millimetres thick, it can easily withstand the weight of the solar panels and of personnel carrying out installation or maintenance tasks.
Apart from HPP Banja, Statkraft operates another hydropower plant – Moglice, with an installed capacity of 197 MW, which opened last year.
Albania is a very promising location for solar projects, because of the high number of sunshine hours. Recently the country has finished the third auction for the construction of solar power plants. Albania’s power utility KESH is also developing a 12.9 MW floating solar facility in the north of Albania, as well as a 5.1 MW solar power plant at one of the three dams at the reservoir of its Vau i Dejës hydropower plant.
Milestone in an innovative floating solar project
CEO of Statkraft Christian Rynning-Tønnesen said the first unit is a great milestone in an innovative floating solar project.
“We are looking forward to the concrete results of this demonstration project to assess the potential for further expansion of this exciting technology,” he said.
According to Rigela Gegprifti, Statkraft’s Country Head in Albania, the achievement marks an important milestone for the company in Albania.
“After the start of commercial operations of our Banja and Moglice hydropower plants, we are looking into further optimising these renewable assets. The Banja Floating Solar Plant is a concrete example for further integration of different resources of renewable energy,” she said.
CEO of Ocean Sun Børge Bjørneklett that the company looks forward to the second stage of the project and to demonstrate the high performance of its solution.
Hybrid projects which involve hydropower and photovoltaics are becoming more and more attractive for operators of hydropower plants. The combination solves the issue of low water levels, which reduces the production of hydropower plants. Two companies from the region recently announced such projects – Slovenia’s DEM, and BiH’s Hidroelektrane na Vrbasu.
Greece is also making major steps in using the potential of floating solar technology.
By Vladimir Spasic
BALKAN GREEN ENERGY NEWS
There’s a new ocean!
On World Oceans Day, Nat Geo cartographers say the swift current circling Antarctica keeps the waters there distinct and worthy of their own name: the Southern Ocean.
Those familiar with the Southern Ocean, the body of water encircling Antarctica, know it’s unlike any other.
“Anyone who has been there will struggle to explain what's so mesmerizing about it, but they'll all agree that the glaciers are bluer, the air colder, the mountains more intimidating, and the landscapes more captivating than anywhere else you can go,” says Seth Sykora-Bodie, a marine scientist at the National Oceanic and Atmospheric Administration (NOAA) and a National Geographic Explorer.
Since National Geographic began making maps in 1915, it has recognized four oceans: the Atlantic, Pacific, Indian, and Arctic Oceans. Starting on June 8, World Oceans Day, it will recognize the Southern Ocean as the world’s fifth ocean.
“The Southern Ocean has long been recognized by scientists, but because there was never agreement internationally, we never officially recognized it,” says National Geographic Society Geographer Alex Tait.
Geographers debated whether the waters around Antarctica had enough unique characteristics to deserve their own name, or whether they were simply cold, southern extensions of the Pacific, Atlantic, and Indian Oceans.
“It’s sort of geographic nerdiness in some ways,” Tait says. He and the National Geographic Society’s map policy committee had been considering the change for years, watching as scientists and the press increasingly used the term Southern Ocean.
The change, he adds, aligns with the Society’s initiative to conserve the world’s oceans, focusing public awareness onto a region in particular need of a conservation spotlight.
“We’ve always labelled it, but we labelled it slightly differently [than other oceans],” Tait says. “This change was taking the last step and saying we want to recognize it because of its ecological separation.”
Marine biologist and National Geographic Explorer at Large Sylvia Earle praised the cartographic update.
“While there is but one interconnected ocean, bravo to National Geographic for officially recognizing the body of water surrounding Antarctica as the Southern Ocean,” Earle wrote in an e-mailed statement. “Rimmed by the formidably swift Antarctic Circumpolar Current, it is the only ocean to touch three others and to completely embrace a continent rather than being embraced by them.”
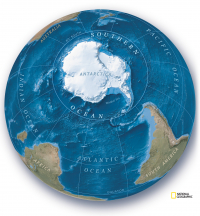
Limits of the Southern Ocean
National Geographic now recognizes five world oceans. Most of the waters that surround Antarctica out to 60 degrees south latitude, excluding the Drake Passage and the Scotia Sea, constitute the newly acknowledged Southern Ocean.
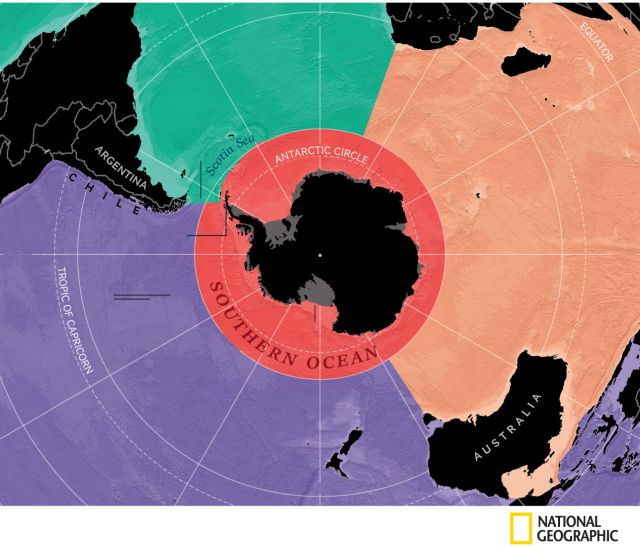
An ocean defined by its current
While the other oceans are defined by the continents that fence them in, the Southern Ocean is defined by a current.
Scientists estimate that the Antarctic Circumpolar Current (ACC) was established roughly 34 million years ago when Antarctica separated from South America. That allowed for the unimpeded flow of water around the bottom of the Earth.
The ACC flows from west to east around Antarctica, in a broad fluctuating band roughly centred around a latitude of 60 degrees south—the line that is now defined as the northern boundary of the Southern Ocean. Inside the ACC, the waters are colder and slightly less salty than ocean waters to the north.
Extending from the surface to the ocean floor, the ACC transports more water than any other ocean current. It pulls in waters from the Atlantic, Pacific, and Indian Oceans, helping drive a global circulation system known as the conveyor belt, which transports heat around the planet. Cold, dense water that sinks to the ocean floor off Antarctica also helps store carbon in the deep ocean. In both those ways, the Southern Ocean has a crucial impact on Earth’s climate.
Scientists are currently studying how human-driven climate change is altering the Southern Ocean. Ocean water moving through the ACC is warming, scientists have learned, but it’s unclear how much this is impacting Antarctica. Some of the most rapid meltings of the continents ice sheets and shelves have been where the ACC is closest to land.
An environment like no other
For now, by fencing in the frigid southern waters, the ACC helps keep Antarctica cold and the Southern Ocean ecologically distinct. Thousands of species live there and nowhere else.
The Southern Ocean “encompasses unique and fragile marine ecosystems that are home to wonderful marine life such as whales, penguins, and seals,” notes National Geographic Explorer in Residence Enric Sala.
What’s more, the Southern Ocean has ecological effects elsewhere as well. Humpback whales, for example, feed on krill off Antarctica and migrate far north to winter in very different ecosystems off South and Central America. Some seabirds migrate in and out too.
By drawing attention to the Southern Ocean, the National Geographic Society hopes to promote its conservation.
The impacts of industrial fishing on species like krill and Patagonian toothfish (which is marketed as Chilean sea bass) has been a concern in the Southern Ocean for decades. In 1982, catch limits were imposed in the region. The largest marine protected area (MPA) in the world was established in the Ross Sea off West Antarctica in 2016. A number of organizations are working to set aside more MPAs to protect the Southern Ocean’s most critical feeding grounds, for example off the Antarctic Peninsula.
“Many nations across the world support the protection of some of these areas from industrial fishing,” Sala says.
Mapping the world as it is
Since the late 1970s, the National Geographic Society has employed a geographer who oversees changes and tweaks to every map that’s published. Tait has been on the job since 2016.
He says he takes a journalist’s approach to the process. It involves staying on top of current events and monitoring who controls what areas of the world.
“It is important to note it’s a map policy, not a policy about Nat Geo’s position on [geopolitical] disputes,” he says. For example, National Geographic maps show that the U.K. controls the Falkland Islands, even though Argentina claims them too. In disputed areas, Tait works with a team of geographers and editors to determine what most accurately represents a given region.
Minor changes happen on a weekly or biweekly basis. Major changes, like labelling the Southern Ocean, are rarer.
Generally, National Geographic has followed the International Hydrographic Organization (IHO) on marine names. While not directly responsible for determining them, the IHO works with the United Nations Group of Experts on Geographical Names to standardize names on an international scale. The IHO recognized the Southern Ocean in its 1937 guidelines but repealed that designation in 1953, citing controversy. It has deliberated on the matter since but has yet to receive full agreement from its members to reinstate the Southern Ocean.
The U.S. Board on Geographic Names, however, has used the name since 1999. And in February of this year, NOAA officially recognized the Southern Ocean as distinct.
Tait says National Geographic’s new policy will have an impact on how children using maps in school learn to see the world.
“I think one of the biggest impacts is through education,” he says. “Students learn information about the ocean world through what oceans you’re studying. If you don’t include the Southern Ocean then you don’t learn the specifics of it and how important it is.”
By Sarah Gibbens
Survey the World's Water
How much water sloshes around in Earth’s lakes, rivers, and oceans? And how does that figure change over time? The upcoming Surface Water and Ocean Topography (SWOT) mission plans to find out. Targeting a late-2022 launch date, this SUV-size satellite will measure the height of Earth’s water. SWOT will help researchers understand and track the volume and location of water – a finite resource – around the world, making NASA’s first truly global survey of the planet’s surface water.
The data will help to monitor changes in floodplains and wetlands, measure how much freshwater flows into and out of Earth’s lakes and rivers and back to the ocean, and track regional shifts in sea level at scales never seen before. It will provide information on small-scale ocean currents that will support real-time marine operations affected by tides, currents, storm surge, sediment transport, and water quality issues. And the information that SWOT collects will also provide, for the first time, global observational evidence of how circular currents, called eddies, contribute to changes in the ocean, such as to its energy and heat storage, as well as to how carbon moves through the marine environment.
But before the mission can do all that, engineers and technicians need to finish building the spacecraft. The payload that will carry the science instruments for this hefty satellite is taking shape in a clean room at NASA’s Jet Propulsion Laboratory in Southern California, where rigorous testing is underway. Then in late June, it travels to France, where engineers and technicians from the French space agency Centre National d’Etudes Spatial (CNES), their prime contractor Thales Alenia Space, and JPL will complete the build and prepare the satellite for shipment to its California launch site at Vandenberg Air Force Base.
JPL Project Manager Parag Vaze (pronounced vah-zay) is central to ensuring the handoff to his CNES counterpart Thierry Lafon goes smoothly. An engineer by training, Vaze has been working on Earth-satellite missions for 25 years at JPL. He’s been the project manager for several missions that measure sea level, including Jason-2, Jason-3, and the Sentinel-6 Michael Freilich satellite, which launched into low-Earth orbit last November while SWOT was undergoing assembly at JPL.
What intrigues you the most about SWOT?
I think the freshwater aspect of the mission intrigues me the most. Ocean science is absolutely critical to understanding what’s happening with Earth in the mid-to-long-term with climate change and sea-level rise. But I’m originally from India, and I’ve personally seen the difficulties in obtaining clean fresh water for people. I believe in my heart that that will be the challenge of the next century – even more than finding oil and energy alternatives.
How will SWOT help to address that challenge?
First, understanding a problem requires information. There are millions of lakes and rivers on Earth that are good sources of freshwater, but we don’t have any real consistent information on them. Most of the information that people do have comes from ground-based instruments in populated areas.
Being able to measure those lakes and rivers not only in populated areas consistently but also those in other areas that aren’t being measured at all will help with the science. And it could also help with finding additional sources of freshwater. SWOT will collect information on bodies of water across the globe, and this information will be freely available to everybody who needs it.
SWOT’s going to provide incredibly high-resolution data on the planet’s surface water. What tools will it use to do that?
We have the main instrument, the Ka-band Radar Interferometer [KaRIn], which is new. It bounces radar pulses off the surface of the water and receives the return signals with two different antennas at the same time. This allows us to triangulate the height of the water’s surface. This is a high-resolution radar that will be able to “see” rivers and other small water bodies on Earth’s surface. The antennas, which stick out about 16 feet [5 meters] on either side of the satellite, will let us cover about 30 miles [50 kilometres] of Earth’s surface to the right and 30 miles [50 kilometres] to the left of the spacecraft.
There’s also an altimeter that will look straight down and measure the height of the ocean’s surface. This instrument is similar to altimeters we have on satellites like Jason-3 and Sentinel-6 Michael Freilich. We have this more traditional instrument aboard to allow cross-validation with KaRIn data.
We also have a radiometer. Water vapour in the atmosphere affects the propagation of radar pulses from the altimeter or KaRIn, which can throw off the surface height measurements. A radiometer allows us to correct this by measuring the amount of water vapour between the spacecraft and Earth’s surface.
Then we have a few precision orbital positioning instruments – including a global position system – that tell us where the satellite is geolocated in space. Those are the science instruments.
It sounds like you’ll be generating a lot of information. How much data are we talking about, and how is SWOT going to handle it all?
We’re trying to take data 24 hours a day, seven days a week. So overall, we’re planning on downlinking about a terabyte of data every day. We’ve needed to make a couple of additions to the payload to handle all of this information. We’re doing onboard processing – not just compression but the actual processing of the ocean data – to help manage the huge amounts of data the satellite sends back to us. And we also have a unique X-band downlink system that can transmit more than 620 megabits per second.
How much work goes into building a spacecraft like this?
SWOT started to become a reality around 2010, and it has since ramped up to hundreds of engineers and scientists working in the U.S. and Europe, some of whom have invested a significant portion of their careers into this project. The teams have had to work through many cutting-edge development challenges, not only on the satellite but on the ground systems and algorithms.
Many of the missions you’ve worked on have been conducted with international partners. This one includes CNES as well as the Canadian Space Agency and the United Kingdom Space Agency. Why has this kind of cooperation been such a big part of your work?
Planning, executing, and funding these kinds of missions is a really big endeavour, and it requires commitment and trust. We’ve been successful at this because we can share the burden and the risk. And we’ve been able to do that because they need for the kinds of information that these satellites collect has been expressed across the globe. The problems they’ll help to address are global issues, not just ones that are only happening in places like North America or Europe or Africa.
What about the mission keeps you up at night?
Everything and nothing. Every day brings numerous and diverse sets of challenges, many of which I don’t foresee, even with years of experience. But, I’m able to sleep because I know that we have extremely talented and dedicated people working together to overcome whatever we’re facing.
To learn more about the mission, visit: https://swot.jpl.nasa.gov/
By Jane J. Lee / Ian J. O’Neill
https://climate.nasa.gov/
Drivers of sustainable development

A Policy Brief from the Policy Learning Platform on Environment and resource efficiency
Rivers and wetlands are critical for life on Earth since they provide a wide range of ecosystem services upon which species and habitats, as well as humans and their socio-economic activities entirely, depend, such as food, biodiversity, water and climate regulation. Yet available data point both to their continuous degradation as well as to limited and slow-paced efforts to restore their natural functions.
According to the European Environmental Agency (EEA), only around 40% of the 110,000 bodies of surface water in the EU (i.e. rivers, lakes and transitional and coastal waters) are currently in good ecological status and only 38% in a good chemical status1, which will make it hard to achieve the corresponding goals set by the Water Framework Directive. The Global Wetland Outlook published by the Secretariat of the Ramsar Convention on wetlands of international importance also portrays a worrying situation as it reports that our continent lost 35% of its inland and coastal wetlands since 1970. Most damages are being recorded in Mediterranean Europe, where almost half of the natural wetlands have disappeared.
The present policy brief aims to provide a clear overview on how the current EU policy framework may guide and support local and regional authorities in the implementation of river and wetland restoration measures and of nature-based solutions to improve or reverse the abovementioned trends. It also intends to put the spotlight on the wealth of good practices from Interreg Europe projects that can serve as an inspiration for untapping the potential of rivers as drivers of local and regional sustainable development. In this respect, particular attention will be devoted to showcasing ways to valorise the natural and cultural heritage along inland watercourses, foster sustainable transport on inland waterways, integrate wetlands in green-blue infrastructures and preserve nature and culture around river mouths.
Challenges for inland waters
Rivers and wetlands are subjected to multiple pressures mainly related to land-use change and pollution. Land-use change impacting these natural resources has been a reality in Europe for centuries. Wide-scale wetland drainage projects as well as the canalisation of rivers and streams have been undertaken to free space for agriculture and urban development, swiping away these water bodies or altering their ecological character.
A factor that historically weighted on the modification of rivers is the construction of large dams and barriers along river axis to enable the generation of electricity by hydropower plants. In many cases around Europe such projects have led to an impoverishment of the ecological status of rivers since, besides influencing their flows, they also affected biodiversity and ecosystems hosted by the latter. Among others, this has been identified as the main cause of the 93% decline in migratory freshwater fish witnessed in Europe in the last five decades2.
Removing barriers
The EEA has recently taken a strong stance in favour of the removal of obsolete barriers to restore European rivers into their free-flowing state. The Agency in fact reported that barriers – over 1 million throughout the continent – constitute a significant pressure for over 20% of surface water bodies and indicated that dam removal can be a viable solution for restoring river continuity, especially if targeted at obsolete barriers3. The Agency, therefore, encouraged the prioritisation of measures to restore continuity and the adoption of strategies and coordinated approaches in this regard at all levels. At the same time, it recognised that the use of barriers along watercourses remains necessary for activities such as hydropower production, navigation and flood protection, which are supported by various EU policies and instruments. Hydropower, for instance, will be essential to decarbonise the energy mix and achieve RED II targets4 for 2030 in many regions and the ongoing efforts to partially shift onto inland waterways freight transport will also continue to require the regulation of river flows through barriers.
Barriers to the exploitation of rivers for hydro-electrical purposes or otherwise regulating their flows are not the sole factor that contributes to detaching them from their floodplains and to deteriorating their ecological status. As indicated above, also urban development and agriculture concur greatly to altering river conditions as well as those of lakes, transitional, coastal waters, seas and groundwater bodies.
The European agricultural sector, in particular, should undergo meaningful changes to decrease the pressure it exerts on water bodies, according to another recent EEA report5. The Agency called upon EU policymakers to recognise the value of agroecological principles, organic farming and nature-based solutions for greening agriculture in Europe and suggested that the post-2020 Common Agricultural Policy (CAP) should encourage their wider uptake. Nature-based solutions, for instance, can be very effective in limiting at source pollution caused by farming, hence reducing this type of pressure on water bodies while also delivering on greenhouse gas emission reductions and biodiversity protection.
Restoring rivers and wetlands
The importance of restoring rivers and wetlands and implementing nature-based solutions has been notably stressed also by the Intergovernmental Science-Policy Platform on Biodiversity and Ecosystem Services (IPBES) in its 2019 ‘Global report on biodiversity and ecosystem services. The report, which provides an independent scientific assessment on the state of nature worldwide and aims to inform the development of the post-2020 multilateral framework on biodiversity6, defines a series of ‘approaches of sustainability that governments, public authorities, communities and private stakeholders are invited to adopt for the purpose of restoring, protecting and enhancing nature and generating multiple long-term socio-economic benefits.
Some of these approaches to sustainability entail taking actions for preventing the degradation of wetlands to enable the effective management and sustainable use of terrestrial landscapes and to improve freshwater management, protection and connectivity. Concerning nature-based solutions, the IPBES global report suggests that they should be integrated into approaches to sustainability aimed at building sustainable cities, where their cost-effective utilisation can strengthen the green infrastructure and sustain urban development in a manner that contributes to climate mitigation and adaptation.
The current EU policy context
Presented by the European Commission as the growth strategy that will guide the transition towards a carbon-neutral economy by 2050, the European Green Deal (EGD) also constitutes the relevant framework for the topic addressed by this policy brief. The EGD communication has indeed introduced the overarching goal of restoring the natural functions of ground and surface waters ‘to preserve and restore biodiversity in lakes, rivers, wetlands and estuaries, and to prevent and limit the damage from floods’. The fact that rivers and wetlands are high on the EU policy agenda is furthermore confirmed by the assessment of a series of policy instruments adopted under the EGD since its inception in December 2019, which have further shed light on how to implement the various aspects of the aforementioned goal and on how rivers and wetlands can help European cities and regions to become carbon neutral.
Interreg Europe Policy Learning Platform on Environment and resource efficiency
Thematic experts:
Marco Citelli & Astrid Severin

Evolve under the climate change

Crop evapotranspiration assessment under climate change in the Pannonian basin during 1991–2050
(An excerpt from the paper Nistor et al., 2017)
Food resources and cultivated areas are one of the priorities of the development and sustainability agenda for humanity’s future. Even if the globe is an endless source of food, the costs and good management of territories make a real difference between many agricultural regions of the world. In this scenario, the best areas are those that exhibit the most favourable conditions in terms of adequate climate for agriculture, morphological characteristics and fertile soils. Almost all agricultural lands and eco-regions need to preserve future functionality. Being a primary good that impacts society, agriculture and transportation, water represents the most valuable resource on a regional scale (Jiménez Cisneros et al., 2014). Hence, the quantity of available water is an important measure for recent climate change (Shahgedanova et al., 2005).
The present climate is warming (Shaver et al., 2000; Oerlemans, 2005; Dong et al., 2013; Xie et al., 2013) and, for the 21st Century, increases in average temperatures on one side and decreases in precipitation rates were announced (Stocks et al., 1998; IPCC, 2001; Stavig et al., 2005). Climate change is easily observed between different regions, e.g. the Alps range and Carpathians range, Pannonia plain and Po plain. In this work, climate data on precipitation, temperature and actual evapotranspiration together with Corine Land Cover 2006 are the main datasets that were taken into account. Boegh et al. (2009) created a model of water balance, considering the evapotranspiration and runoff modelling of main land cover types for Sjaelland Island, Denmark.
Recently, Mojid et al. (2015) argued that climate change impacts crop water demand. Pravalie (2014) and IPCC (2007) recall that evapotranspiration on a global scale is related to the trend in temperature and other complex factors of anthropogenic nature. As previously mentioned by Chen et al. (2006) and Kousari et al. (2013) reported that evapotranspiration is the third important climatic factor that controls terrestrial ecosystems and the atmosphere mass exchange. Thus, the assessment of crop evapotranspiration (ETc) becomes a significant indicator that is commonly used in regional water balance and irrigation surveys. Kurnik et al. (2014), in their study of water deficit in agricultural regions of Europe, created a soil water balance model that included simulations of soil water deficit and actual evapotranspiration. The assessment of sensitive parameters using different evapotranspiration methods was attempted by Ambas and Baltas (2012) in the Prefecture of Florina, Western Macedonia. Nistor and Porumb-Ghiurco (2015) applied the geographical information system (GIS) applications and empirical formulae to calculate the land cover evapotranspiration on a regional scale. Recently, Nistor (2016) used GIS to compute the spatial distribution of climate indices in the Emilia-Romagna region. Thus, the present methodology was adopted from similar studies related to crop evapotranspiration (ETc) in the Emilia-Romagna region (Nistor and Porumb-Ghiurco, 2015) and the Carpathian region of Europe (Nistor et al., 2016).
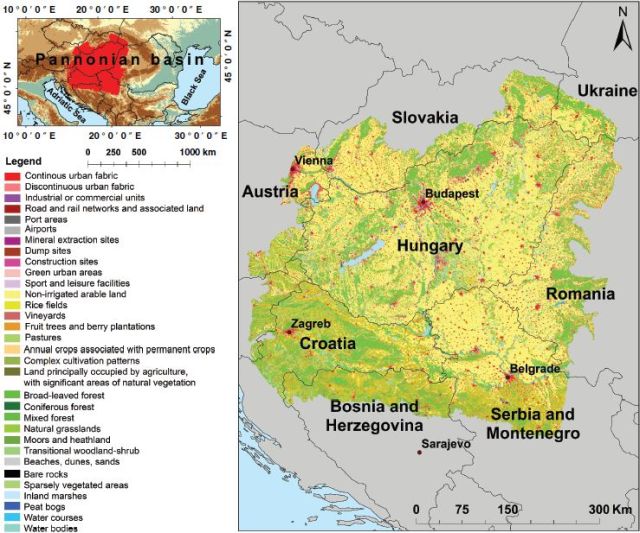
Figure 1. Location of the Pannonian basin on the Europe map (a) and land cover of the Pannonian basin (b)
Study area
The Pannonian basin is located in the central part of Europe, between 43°50 ' and 49°15' latitude N and 15°06' and 23°30' longitude E (Figure 1). The region largely overlaps with the Pannonian plain and extends over nine countries: Austria, Slovenia, Hungary, Croatia, Bosnia-Herzegovina, Serbia and Montenegro, Romania, Slovakia and Ukraine. The physical characteristics of the Pannonian basin are the low land including the Great Hungarian Plain, the Danube plain, the Sava plain and the Drava plain (European Environment Agency, 2007). The surroundings of this region are bounded by the Alps range in the west, by the Carpathians in the north and east and by the Dinarics in the south.
As far as the climate is concerned, the Pannonian basin is characterized as fully humid Cfa in the southeastern part of the region and Cfb in most of the territory (Kottek et al., 2006). The Cfb climate class is characterized by a fully humid climate with warm summers (Kottek et al., 2006). The Pannonian basin has a Dfb climate near the Carpathian mountains in the northeastern side and on the western side close to the Alps. The Dfb climate class represents a humid continental climate, characterized by fully humid seasons with warm summers and cold winters (Kottek et al., 2006). The precipitation ranges from 400mmin the eastern part to 1800mm in the western part. The highest annual temperature of the Pannonian basin is up to 12.64 °C in the south-central parts of the region and displays the lowest values in the northern part of the region. The potential evapotranspiration (ET0) ranges from 586 to 739 mm. The average precipitation, temperature and ET0 climate data relative to the recent period (1991–2020) and future period (2021–2050) are shown in Figure 2.
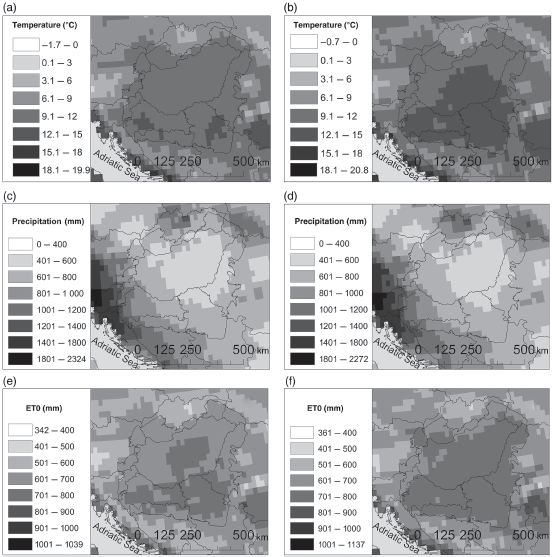
Figure 2. (a) The mean annual air temperature between 1991 and 2020. (b) The average mean annual air temperature between 2021 and 2050. (c) The average mean annual precipitation between 1991 and 2020. (d) The average mean annual precipitation between 2021 and 2050. (e) The average annual ET0 between 1991 and 2020. (f) The average annual ET0 between 2021 and 2050.
The main types of soils found in the study area are chernozems and black soils rich in humus (European Environment Agency, 2007), characterizing the Pannonian basin as an important agricultural land in central Europe. The widespread land cover area is represented by grass, pasture, agricultural area and forest. The forest land includes the main species of oak (Quercus), beech (Fagus), elm (Ulmus) and hornbeam (Carpinus) (European Environment Agency, 2007).
Conclusions
The main aim of the study was to calculate crop evapotranspiration ((ETc) in the Pannonian basin for the present and future periods. Even if the goals were achieved, limitations come from overlapping growth of each land cover type. The complex cultivation period data of the Pannonian basin is hard to integrate into four stages because the real situation requires more overlaps between crop growth. Nistor and Porumb (2015) explain very well how to evaluate the ETc at the regional level, applying the same methodology to the data relative to the Emilia-Romagna region in Italy.
The work presented here shows how to assess the ETc at the space level using the land cover database and climatological spatial data. The methods should be improved with specific file measurements, to be closer to the real situation. Climate changes mostly contribute to the distribution of evapotranspiration in the Pannonian Basin. The work applies well to the management and assessment of water resources in agricultural lands. The future scenario shows howETc in the Pannonian basin will evolve under climate change during 2021–2050. Several places from the south and southwestern sides of the region with values of annual ETc exceeding 1000mm were found. The findings are useful to agriculture planning, climatology of the Pannonian basin and for identification of critical water areas and irrigation demand areas. In the future, the focus will be on the projection of land cover, not only on scenarios related to climate data. The results may be useful in the calculation of groundwater vulnerability of the area under climate change.
Margarit-Mircea Nistor, Sorin Cheval, Alessandro F. Gualtieri, Alexandru Dumitrescu, Vanessa E. Botan, Alex Berni, Gheorghe Hognogi, Ioan A. Irimu and Cosmin G. Porumb-Ghiurco (2017) Crop evapotranspiration assessment under climate change in the Pannonian basin during 1991–2050. Meteorol. Appl. 24: 84-91
You can find the whole paper at this address:
https://rmets.onlinelibrary.wiley.com/doi/full/10.1002/met.1607
More...
World’s largest iceberg

The 4,320 square kilometre slab of ice dubbed A-76 broke off Ronne shelf and is floating in Weddell sea
A giant slab of ice almost four times the size of New York City has sheared off from the frozen edge of Antarctica into the Weddell Sea, becoming the largest iceberg afloat in the world, according to the European Space Agency.
The newly calved berg, designated A-76 by scientists, was spotted in recent satellite images captured by the Copernicus Sentinel-1 mission, the space agency said in a statement posted on its website with a photo of the enormous, oblong ice sheet.
Its surface area spans 4,320 sq km (1,668 sq miles) and it measures 175km (106 miles) long by 25km (15 miles) wide.
By comparison New York City’s total area of land and water is 1,213 sq km while the Spanish island of Mallorca in the Mediterranean occupies 3,640 sq km.
The enormity of A-76, which broke away from Antarctica’s Ronne ice shelf, ranks as the largest existing iceberg on the planet – surpassing A-23A, which is about 3,380 sq km and is also floating in the Weddell Sea.
Another big Antarctic iceberg that had threatened a penguin-populated island off the southern tip of South America has since lost much of its mass and broken into pieces, scientists said earlier this year.
A-76 was first detected by the British Antarctic Survey and confirmed by the US National Ice Center based in Maryland using imagery from Copernicus Sentinel-1, consisting of two polar-orbiting satellites.
The Ronne ice shelf on the flank of the Antarctic Peninsula is one of the largest of several enormous floating sheets of ice that connect to the continent’s landmass and extend out into the surrounding seas.
Periodic calving off of large chunks of those shelves is part of a natural cycle. But some ice shelves along the Antarctic peninsula have undergone rapid disintegration in recent years, a phenomenon scientists believe may be related to climate change.
The Guardian
AI under the sea

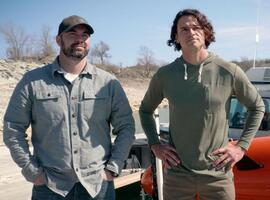
Terradepth CEO talks about a project to map out and collect data from all the oceans of the world. The company uses artificial intelligence and machine learning to gather and make sense of the data.
TechRepublic's Karen Roby spoke with Joe Wolfel, co-CEO of Terradepth, about the company's ocean data-collection robot. The following is an edited transcript of their conversation.
Karen Roby: I think this is a good way to summarize that what you guys are doing and are working toward is a fleet of fully autonomous deep ocean data collection submarines. Tell us a little bit about how this came about? I mean, you don't just wake up one day and say, yeah this is what I think I'm going to do. I mean, this has been a whole lifetime of work I guess, that's feeding into this.
Joe Wolfel: It has been a long time in the making. So my co-founder and I met in the Navy, actually, in 2004. So, it's been a while in the works, but we met there and kind of started to understand how really little humanity understands about the ocean. And that idea set in the back of our heads since then. And so finally, we got to a position where we were able to start Terradepth and here we are.
Karen Roby: When you say humans, that we know so little, I mean, how much do we really know? I mean, there's so vast the amount to cover there.
Joe Wolfel: The ocean encompasses about 70% of the planet's surface area, and that's a number you hear a lot. You also hear that we know more about the surface of Mars than we do about the ocean, which is also a fact. But a number that people don't really think about too much is 98.5. And 98.5% is actually the amount of Earth's biosphere that is comprised of the ocean. And so that's all the livable space on the planet. And so 98 and a half per cent of that is the ocean. And the ocean just attenuates signals so badly that you can't fly satellite constellations over it and get all this data that we can in the terrestrial world. Right? So that means you need to be in the ocean to get that data in situ, as we say, which drives a whole set of technical hurdles and challenges that you really need to overcome. If you're going to increase humanity's understanding of what we call the final frontier action.
Karen Roby: We talk about collecting data and I can't imagine, I mean, there's got to be a wealth of things down there that you want to study. Talk a little bit about the things that you hope to look at and what all would be involved here.
Joe Wolfel: The ultimate vision of Terradepth is to really complete what the Google Earth initiative started. Google Earth started and we've got very high-resolution maps of the terrestrial environment, but we don't really have good ones of the ocean. A lot of the bathymetry, the typology of the seabed that you see on, say, Google Earth, is really extrapolated data from satellites where the satellite say, "OK, well, this is the way that the surface of the ocean is behaving, so there must be something of gravitational importance down there." This is why you have the U.S. Navy submarines running into mountains, like what happened in 2005. So, a major effort at Terradepth is to gain bathymetry on a scale so that we really understand what the bottom of the seabed looks like to a high degree, enough of resolution that we can make good decisions about what's down there.
Joe Wolfel: But, part of a Terradepth data collection story is really much broader than that, right? Because we're going to be going into this very hostile remote environment. So, we want to get all the data that we possibly can. We've designed a way to provide high energy at sea to the robot so that we can have a multitude of sensors. So, instead of just bathymetric data, now we're talking about getting chemical data, environmental DNA data, optical data and others. So, really we're just limited by the amount of energy we can deliver to that sensor payload on the robot.
Karen Roby: When you talk about that amount of data, Joe, obviously more than humans, when that information is back here to us, can actually go through, I mean, artificial intelligence playing a big role, machine learning here.
Joe Wolfel: Correct. AI and machine learning actually plays a role in both our data collection operation and on the back end when the user is going to interact with the ocean data. Our first major milestone really was proving that we could do an advanced at a high degree of edge compute on the robot in the water all inside of a pressure vessel, really. We've worked on two machine learning models that we run simultaneously in that data processing pipeline. What that allows is for the robot to go do a surveying mission and then making inferences about what it saw, whether it's an object of importance or a region of importance. And then go back and resurvey for greater fidelity on that data that it collected the first time, all autonomously with no human in the loop in that operation. So that's where AI/ML plays a role in the robot. But then also when you're dealing, to your point, Karen, with these terabytes of data that are coming back, we've also taken a hard look at how to reduce human cognitive load while you're looking for things that are important, right? We're using those machine learning models then to flag human interests in the cloud.
Karen Roby: Joe, you mentioned that major milestone too, just getting over that. Where do you stand in terms of the trials and what type of timeline are you looking at now?
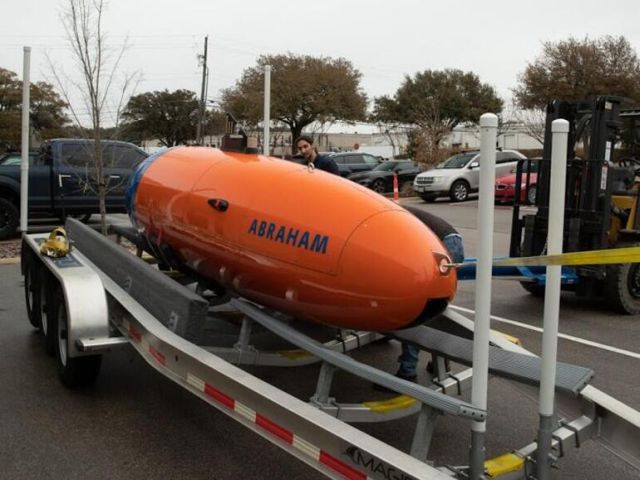
Joe Wolfel: Backing up a little bit. The first thing that you really need to do to scale ocean data is making the robot really smart. Right? So, that's the thing that we just proved. But it doesn't matter if your robot is really smart if your robot can't stay out for a very long time without humans interacting with it. Right. If you're going to be recovering this robot every day, two, three days, it's just unscalable, especially with 310 million square kilometres of ocean that needs surveying.
So, the next major milestone will be placing an energy recharge system, a fully autonomous energy recharge system in the submersible, and then making sure that we've got a really smart robot. And now we've got a really smart robot that can stay out for a very long amount of time because we can autonomously recharge our batteries to continue doing data collection operations. We anticipate that test will be done sometime in the next 90 to 120 days. At which point we'll have proven us, we call it the con-op, the concept of operations at Terradepth, which is really the key we think to have a scalable ocean data collection capability.
Karen Roby: Joe, going from being a Navy SEAL and then now to bringing this dream to life, I mean that's really fascinating how you've gone from that to now this and really going to be great to see how it takes off.
Joe Wolfel: Thanks. We're excited. We got a great team doing both the data collection piece and the data utilization and interaction side of the house. It's a complex strategy that we're running here, but we've got a great team who's helping us along the way, getting it done.
by Karen Roby (TechRepublic)
Stratosphere shrinkers

Thinning indicates a profound impact of humans and could affect satellites and GPS
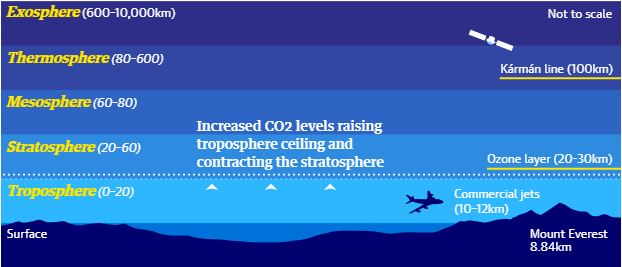
Humanity’s enormous emissions of greenhouse gases are shrinking the stratosphere, a new study has revealed.
The thickness of the atmospheric layer has contracted by 400 metres since the 1980s, the researchers found and will thin by about another kilometre by 2080 without major cuts in emissions. The changes have the potential to affect satellite operations, the GPS navigation system and radio communications.
The discovery is the latest to show the profound impact of humans on the planet. In April, scientists showed that the climate crisis had shifted the Earth’s axis as the massive melting of glaciers redistributes weight around the globe.
The stratosphere extends from about 20km to 60km above the Earth’s surface. Below is the troposphere, in which humans live, and here carbon dioxide heats and expands the air. This pushes up the lower boundary of the stratosphere. But, in addition, when CO2 enters the stratosphere it actually cools the air, causing it to contract.
Greenhouse gas emissions are changing the structure of Earth’s lower atmosphere
The shrinking stratosphere is a stark signal of the climate emergency and the planetary-scale influence that humanity now exerts, according to Juan Añel, at the University of Vigo, Ourense in Spain and part of the research team. “It is shocking,” he said. “This proves we are messing with the atmosphere up to 60 kilometres.”
Scientists already knew the troposphere was growing in height as carbon emissions rose and had hypothesised that the stratosphere was shrinking. But the new study is the first to demonstrate this and shows it has been contracting around the globe since at least the 1980s, when satellite data was first gathered.
The ozone layer that absorbs UV rays from the sun is in the stratosphere and researchers had thought ozone losses in recent decades could be to blame for the shrinking. Less ozone means less heating in the stratosphere. But the new research shows it is the rise of CO2 that is behind the steady contraction of the stratosphere, not ozone levels, which started to rebound after the 1989 Montreal treaty banned CFCs.
The study, published in the journal Environmental Research Letters, reached its conclusions using the small set of satellite observations taken since the 1980s in combination with multiple climate models, which included the complex chemical interactions that occur in the atmosphere.
“It may affect satellite trajectories, orbital lifetimes, and retrievals […] the propagation of radio waves, and eventually the overall performance of the Global Positioning System and other space-based navigational systems,” the researchers said.
Prof Paul Williams, at the University of Reading in the UK, who was not involved in the new research, said: “This study finds the first observational evidence of stratosphere contraction and shows that the cause is in fact our greenhouse gas emissions rather than ozone.”
“Some scientists have started calling the upper atmosphere the ‘ignorosphere’ because it is so poorly studied,” he said. “This new paper will strengthen the case for better observations of this distant but critically important part of the atmosphere.”
“It is remarkable that we are still discovering new aspects of climate change after decades of research,” said Williams, whose own research has shown that the climate crisis could triple the amount of severe turbulence experienced by air travellers. “It makes me wonder what other changes our emissions are inflicting on the atmosphere that we haven’t discovered yet.”
The dominance of humanity activities on the planet has led scientists to recommend the declaration of a new geological epoch: the Anthropocene.
Among the suggested markers of the Anthropocene are the radioactive elements scattered by nuclear weapons tests in the 1950s and domestic chicken bones, thanks to the surge in poultry production after the second world war. Other scientists have suggested widespread plastic pollution as a marker of a plastic age, to follow the bronze and iron ages.
By Damian Carrington (The Guardian)
Water Resources and Agriculture in Serbia
CLIMATE CHANGE, POLLUTION, BAD MANAGEMENT
Water - the most critical resource
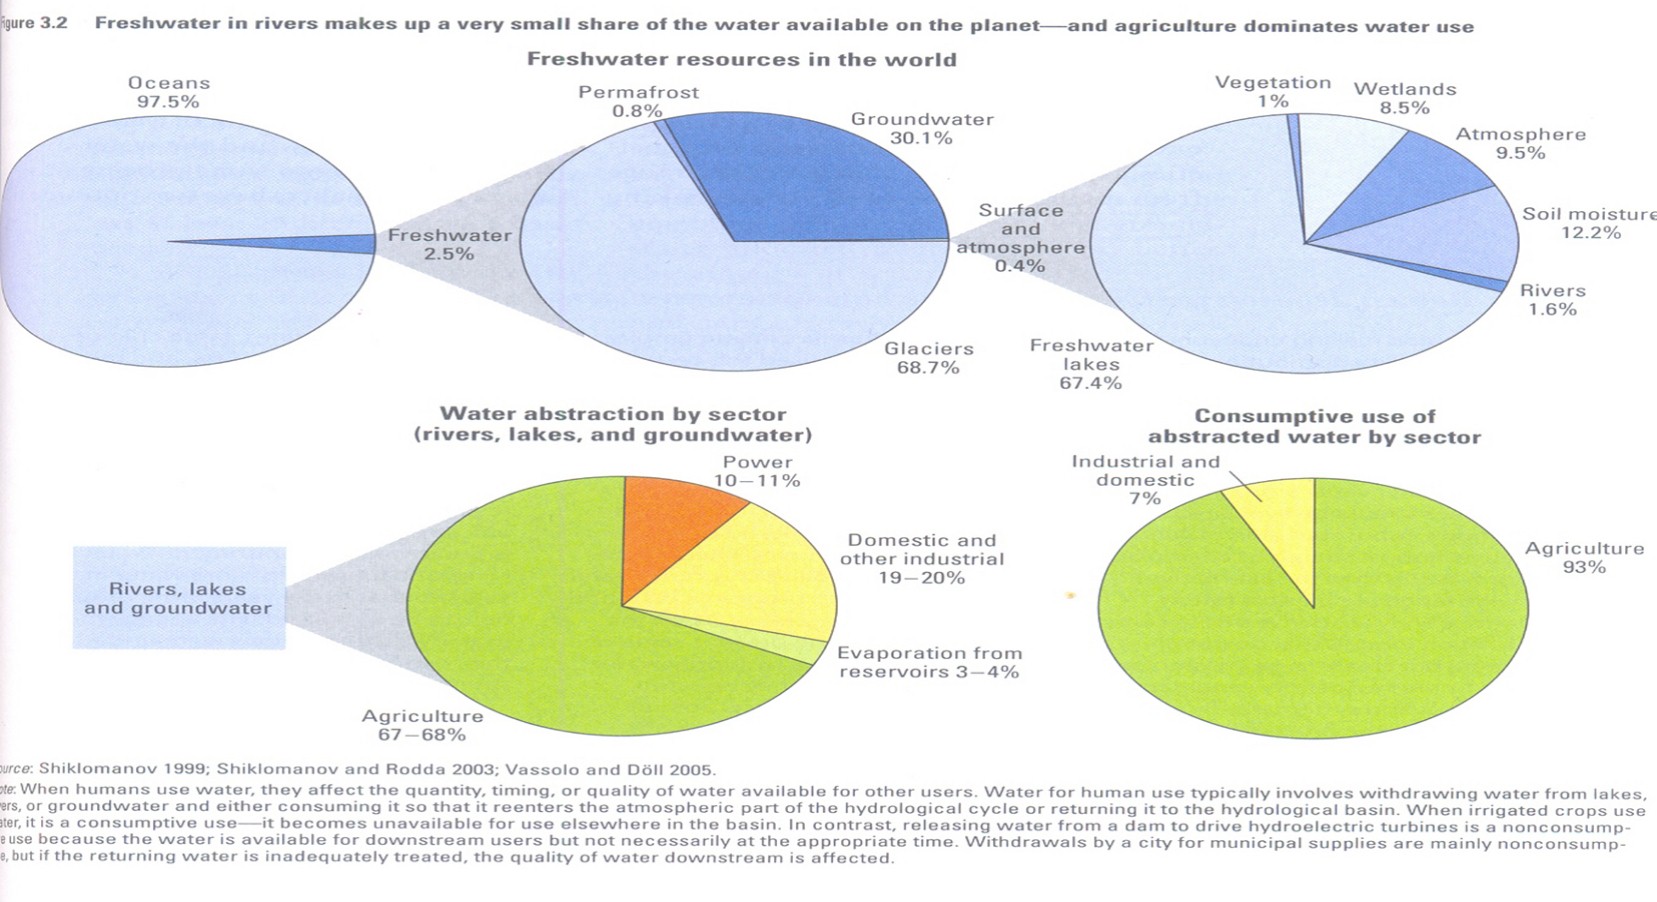
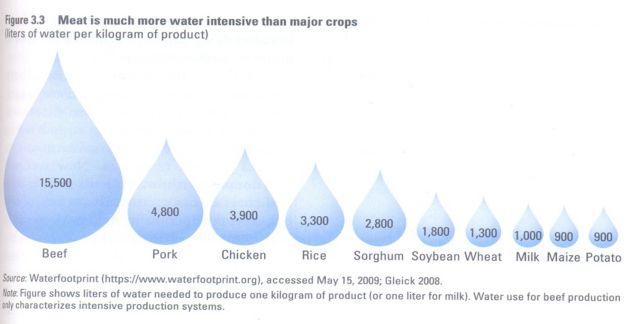
How much water do we use in food production?
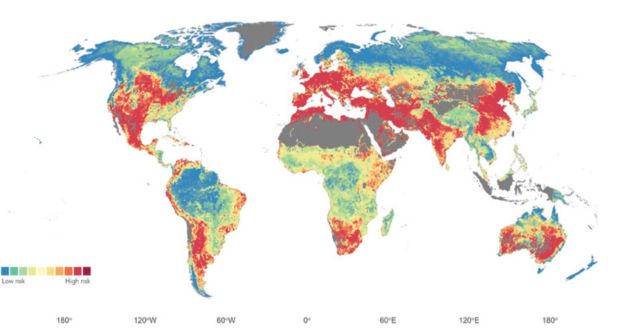
Water resources in risk (BOD, N, El. Cond)
(www.worldbank.org/qualityunkown)
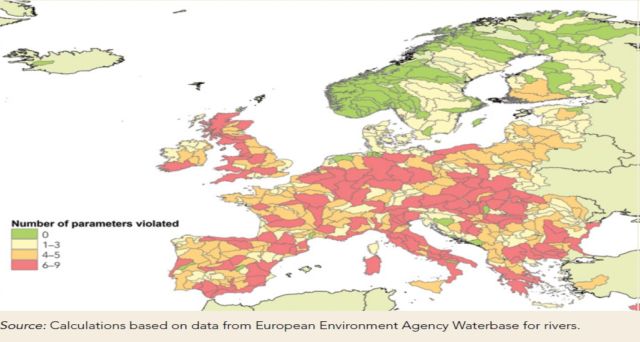
Number of water quality parameters violated in Europe 2000/2012
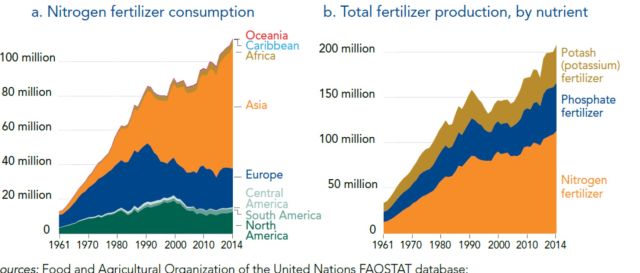
Global fertilizer production and consumption 1961/2014
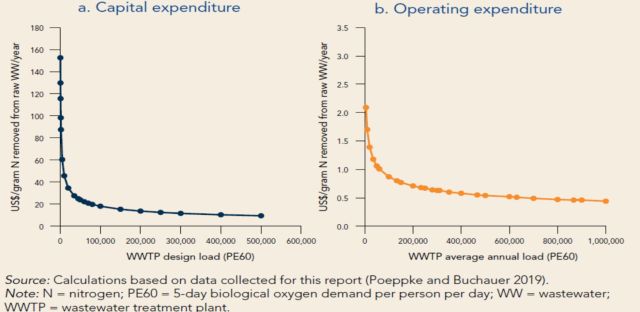
Average water treatment costs (WB 2019)
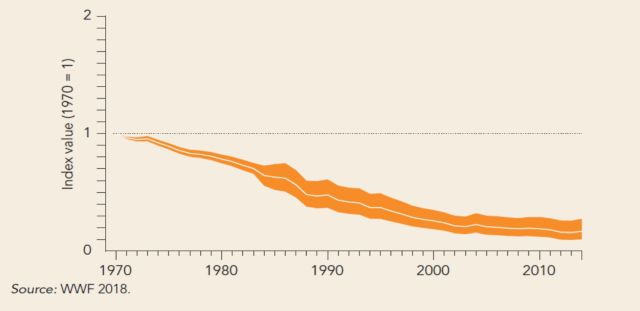
Global decline of fresh-water fish population
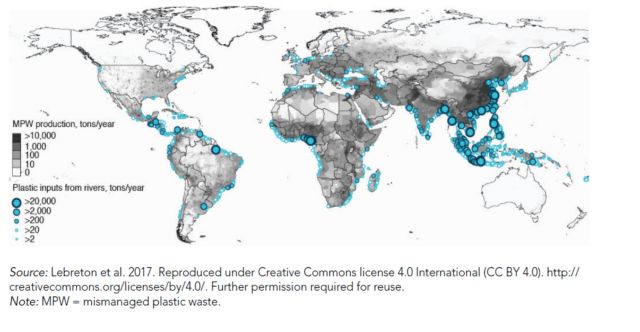
Emissions of plastic waste in rivers and oceans
Water resource problems in Serbia
- Only 13% of surface water resources are domicile, others are transit. Ecological status of surface waters: only 7% are good quality, 0% are excellent.
- Chemical status of surface waters: 80% are good.
- Only 56% of municipal water systems have satisfactory water quality. Other 44% do not have satisfactory water quality.
- Water losses in municipal water systems are about 35% on average.
- Only 37% of water in rural supply systems is satisfactory. Other 63% of water in rural systems is unsatisfactory or of unknown quality.
- Water losses in rural systems are unknown.
Unanswered questions
- How to keep water resources in Serbia?
- Are the man-made water accumulations expected to be the right solution?
- What is the socio/ecological consequences of mini-hydropower plants?
- Are public water management companies viable policy entities?
- What will happen with the subterranean water resources in near future?
- Are the fertilizer and fuel subsidies, (so popular in our agricultural policy) in fact, totally contra-productive and harmful?
- Do we have an adequate climate change adaptation policy mix in agriculture?
Climate Change and Agriculture
- According to some raw and preliminary findings made on the Faculty of the Agriculture University of Belgrade, the annual amount of direct damage caused by drought on the most important agricultural plants varied from 110 million to 305 million Euro in 2017, from 147 million to 368 million Euro in 2018, and from 135 million to 350 million Euro in 2019.
- These are just drought damage estimates, without “hurricane costs” of unexpected weather events.
- The estimations were based on a restrictive assumption that food market prices would remain unchanged. The expected crop losses were assumed to be in an interval between 3% and 8%, like the one used in the similar analysis in Croatia (A Climate for Change - Human Development Report Croatia, 2008) and in Montenegro (The Economic Impact of Climate Change in Montenegro: A first look UNDP, Montenegro, 2010).
What has to be done in regulatory, economic and financial policy? Sooner the better!
- Paradigm shift in water management - a step forward towards EU!
- Resource policy based on the river basins, not according to the local political interests.
- Water price reform. New pricing for subterranean water resources.
- Seasonal pricing for agriculture (French model). Yes or no?
- Block-tariffs for water consumption. Ex post, or Weather-sensitive pricing.
- New design of water effluent charges, volumetric approach based on quantity and pollution type.
- Genuine water funds, independent from the State budget.
- Earmarking of water revenues.
By Radmilo V. Pesic, Ph.D. (Econs)
The author is a Professor of Economics at the University of Belgrade, Department of Agricultural Economics.
He is a member of the Scientific Committee of the International Water Conference. For more details, please see www.radmilopesic.com
References
- Alexandratos, N. & Bruinsma, J.2012. World agriculture towards 2030/2050: the 2012 revision. ESA Working Paper No. 12–03. Rome.
- FAO. 2017 The future of food and agriculture – trends and challenges. Rome.
- Fiskalni savet RS (2018) Investicije u zaštitu životne sredine: društveni i fisklani prioritet. Beograd
- MPŠV (2001) Vodoprivredna osnova Republike Srbije Ministarstvo za poljoprivredu, šumarstvo i vodoprivredu, Institut za vodoprivredu “Jaroslav Černi” Beograd.
- NSOR (2008) Nacionalna strategija održivog razvija Republike Srbije usvojena na Vladi RS 09.05.2008.
- SGRS (2017) Strategija upravljanja vodama na teritoriji Republike Srbije do 2034. godine. Službeni glasnik RS br. 3 od 18.01.2017.
- UNDP (2008) A Climate for Change. Climate Change and its Impacts on Society and Economy in Croatia. Human Development Report
- UNDP (2010) Callaway, J. M., Markovik, M., & Kascelan, S. (2010). The Economic Impacts of Climate Change in Montenegro: A First Look
- WB (2019) Quality Unknown. The Invisible Water Crisis. Damania R. et.al. World Bank Group